


Update : I had the chance to present how to create Lighthouse Custom Audits in London Web Performance Meetup so i share with you the slides and the video here :
In this post i want to show you how to use Google Lighthouse for testing specific things on your web applications thanks to its custom audits ‘hidden’ feature. Custom audits are helpful for many cases :
- Extending the power of Lighthouse !
- Web testing and QA
- SEO testing (I urge you to check Mike King Brighton SEO slides)
- Web performance custom metrics
What is Google Lighthouse ?
Google Lighthouse is a an open-source tool developed by Google Chrome team. Lighthouse run many automated audits against a web page (public or private behind an authentification) and generate a report with passed and failed tests in order to improve the quality on many categories (Performance, Progressive Web Application PWA, SEO, Best practices and Accessibility). It could be run on multiple workflows (in Chrome DevTools, as an extension, from command line or as a node.js module).
Custom metrics and custom audits :
In web performance optimization, we (providers, tools, developers, SEOs, me included) focus too much on the standard metrics (browser based) such as FMP, FCP, Speed index. These metrics are useful to enhance the overall performance, to get better scores but don’t focus on what matters the most : The user’s performance experience !
For that we should try to answer these questions : What’s my hero element on each page ? What must be the fastest element to offer to my users ?
The answer depends on your business type :
– News websites hero element may be the post text and title
– E-commerce product page hero element is the product’s image / price for sure
– E-commerce category page hero elements : cat sale banner, products’ thumbnails, filters, facets..
– Directory/ classifieds website homepage hero element could be the search bar
– Twitter timeline hero element could be the first tweet to display (Time to first tweet)
In this tutorial i will explain how i created a Lighthouse custom audit to check if an e-commerce hero image is fast to display. Here is a screenshot of the final result :
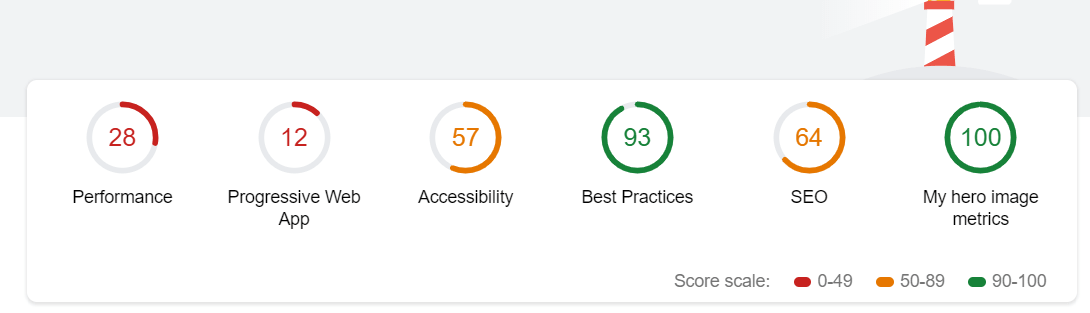
In the Lighthouse report summary, we see that a new audit category is added alongside the default ones : “My hero image metrics” cool !
What will you need to create a Lighthouse custom audit ?
As you know, Lighthouse run audits against a webpage so we will need :
- A product page that contains an image of course, for this i just ‘wget’ a real Amazon product page
- A custom audit created in Lighthouse
1- Configure your web page for the custom audit :
Our page should give an information about when the image is displayed. For that we will use the User Timing API that helps developers to measure the performance of their applications. With this API we can create application specific timestamps. In other words you can measure and report the performance of the rendering of the page, the JavaScript code execution or a specific event in your website..etc.
User Timing API offers some useful methods to mark and measure many events in a webpage. For this tutorial, we will just use : window.performance.mark() that creates a performance entry triggered by the application in specific location. In our case, the page will create a performance mark when the product’s image will be loaded. We add another mark creation in script tag just after the img element. Steve Souders suggests in its test to take the higher value because there could be a difference between load time and display time of the image… anyway it is another topic.
<img onload="window.performance.clearMarks('hero_image'); window.performance.mark('hero_image')" alt="Your SEO alt value" src="https://myimageUrl.jpg">


<script>
window.performance.clearMarks('hero_image');
window.performance.mark('hero_image');

//I store here the variable that Lighthouse will get
window.myCustomMetric = window.performance.getEntriesByType('mark')[0].startTime;
</script>
We add performance.clearMarks() before each performance.mark() to get rid of possible previous marks. Now, when the hero image loads the page creates the performance mark named ‘hero_image’ that will be used by Lighthouse later and that’s what matters until now 🙂
Important : Line 9 : We create a variable to store the time our hero image took to load/display. This will be our only input to Lighthouse. Let’s go to the next step !
2- Create a custom audit in Lighthouse :
Let’s first of all briefly remind the Lighthouse architecture. Lighthouse communicates with Chrome DevTools Protocol through a Driver to collect data from webpages thanks to gatherers. Then, audits run tests on the given artifacts and give output results (JSON) to report generation component. Simple no?!
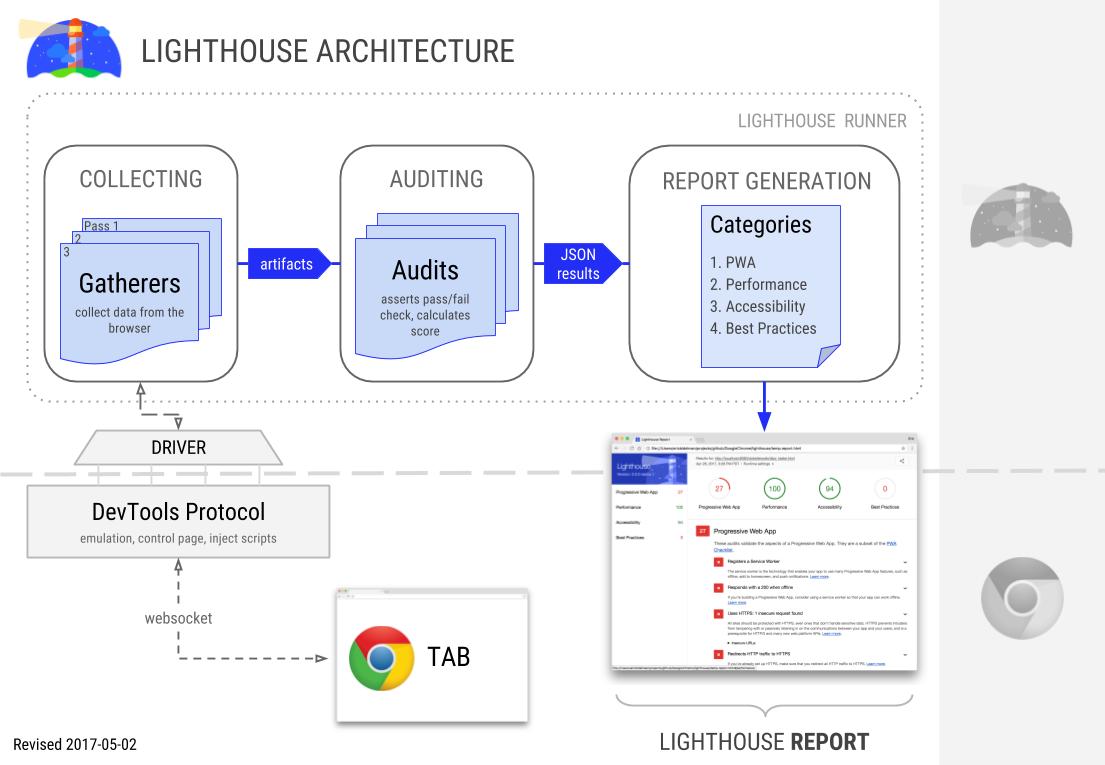
For our custom audit (as mentioned here), we need two components to create a custom audit :
1- A gatherer : this will collect the needed data from the webpage
2- An audit : this will run the test and says if it passes or fails
In addition to the gatherer and audit, we have to create a custom configuration file : this will tells Lighthouse core to run our custom audit.
Let’s start by creating the Lighthouse gatherer :
'use strict';

const Gatherer = require('lighthouse').Gatherer;


class TimeToHeroImg extends Gatherer {
  afterPass(options) {
    const driver = options.driver;
    return driver.evaluateAsync('window.myCustomMetric')
      // Ensure returned value is what we expect.
      .then(loadMetrics => {
        if (!loadMetrics) {
          // Throw if page didn't provide the metrics we expect. This isn't
          // fatal -- the Lighthouse run will continue, but any audits that
          // depend on this gatherer will show this error string in the report.
          throw new Error('Unable to find load metrics in page');
        }
        return loadMetrics;

      });
  }


}

module.exports = TimeToHeroImg;
We are creating here a class named “TimeToHeroImg” that extends the generic Lighthouse Gatherer module.
Line 10 : we get the variable that we created (window.myCustomMetric) from the brwoser
And simply return the value in order to pass it to the audit. FYI : Lighthouse gatherer could do much more things then our simple example : driver.evaluateAsync() could also evaluate JavaScript so that we make less modifications to our production website.
Let’s create the audit file now :
'use strict';

const Audit = require('lighthouse').Audit;

const MAX_LOAD_TIME = 3000;


class LoadAudit extends Audit {
  static get meta() {
    return {
      id: 'heroimage-audit',
      title: 'hero image is loaded',
      failureTitle: 'Hero image is slow to load. More than 3000ms',
      description: 'Used to measure time from navigationStart to when the hero image is loaded',

      // We mention here our custom gatherer
      requiredArtifacts: ['TimeToHeroImg'],
    };
  }

  static audit(artifacts) {
    const loadMetrics = artifacts.TimeToHeroImg;

    // This score will be binary, so will get a red ✘ or green ✓ in the report.
    const belowThreshold = loadMetrics <= MAX_LOAD_TIME;

    return {
      rawValue: loadMetrics,
      // Cast true/false to 1/0
      score: Number(belowThreshold),
    };
  }
}
module.exports = LoadAudit;
In this audit we simply extends the Lighthouse Audit module (line 9), we declare our threshold for this test as 3000ms (line5), define the properties of the audit and precise which gatherer are we using (line 10-20).
Line 23 : We get the value from our gatherer. We test if it is lower than our threshold [3s] (line 26) and give the score (line 28-31).
We have now the gatherer and the audit, we should create a Lighthouse custom config now:
'use strict';

module.exports = {
  // 1. Run your custom tests along with all the default Lighthouse tests.
  extends: 'lighthouse:default',

  // 2. Add gatherer to the default Lighthouse load ('pass') of the page.
  passes: [{
    passName: 'defaultPass',
    gatherers: [
      'heroimage-gatherer',
    ],
  }],

  // 3. Add custom audit to the list of audits 'lighthouse:default' will run.
  audits: [
    'heroimage-audit',
  ],

  // 4. Create a new section in the default report for our results.
  categories: {
    mysite: {
      title: 'My hero image metrics',
      description: 'Is my hero image loading fast ?',
      auditRefs: [
        // When we add more custom audits, `weight` controls how they're averaged together.
        {id: 'heroimage-audit', weight: 1},
      ],
    },
  },
};
The comments are so clear. First, we tell Lighthouse to run as usual the default audits (performance, PWA, SEO…). Second we point to our gatherer and audit and finally we create our custom audit section properties [categories]. For now, we only have one audit to run so the score will be simply the result of this audit (0 if fail, 100 if success).
We are ready to run our first Lighthouse custom audit (make sure to install Lighthouse first : npm install –g lighthouse) :
lighthouse --config-path=custom-config.js https://www.aymen-loukil.com/amazon.html
Lighthouse will run and a Chrome instance will display. At the end an HTML report will be generated in the folder.
Now what ? Only Lighthouse ?
We modified our website for just testing with Lighthouse ? The good news are that User Timing API is more and more supported by many monitoring tools in the market such as
WebPageTest, Dareboost, SpeedCurve, Rigor, Newrelic and Goole Analytics.
Pull the source code of this custom audit and start building yours !
To play with this custom audit, you can pull it from my Github : https://github.com/AymenLoukil/Google-lighthouse-custom-audit
Please let me know in comments if you have any questions or remarks and what would be your next Lighthouse custom audit ?
Thank you for review : Patrick Hulce Bartosz Góralewicz Tomek Rudzki Thomas Steiner Jono Alderson Paul Shapiro Boris Schapira
International SEO Consultant


Clear write-up. Thank you 🙂
This is simply the biggest mind-blowing post that I have read this year! Thanks for sharing!
Thank you Jean-Christophe! Hope you found it useful.
Can we gather AJAX call or xhr request of the webpage in gatherer to measure the performance of the page? Is it possible. If yes, how can we do it for auditing of the page.